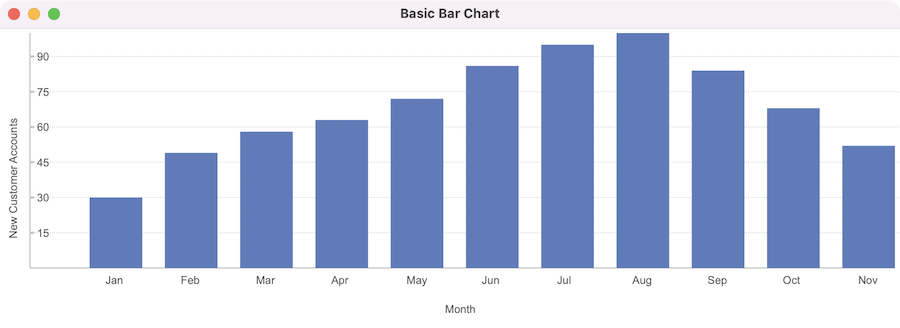
Graphs and Charts 0.2.2 adds a new Bar Chart Custom Control for Glimmer DSL
for LibUI (Prerequisite-Free Ruby Desktop Development Cross-Platform Native
GUI Library).
GitHub :
GitHub - AndyObtiva/glimmer-libui-cc-graphs_and_charts: Graphs and Charts (Custom Controls) for Glimmer DSL for LibUI
RubyGem : glimmer-libui-cc-graphs_and_charts | RubyGems.org | your community gem host
Blog Post Announcement :
Change Log:
0.2.2 :
- Display bar_chart axis labels x_axis_label and y_axis_label
- Display bar_chart x-axis values below the chart
- Fix issue with bar_chart vertical scaling of grid markers when numbers
are larger than 1000 and have K in them by disabling K formatting for now
(the issue was seeing the same marker number twice because two consecutive
markers were calculated with similar shortened values; e.g. both 10K when
one is 10100 and the other is 10750).
0.2.1 :
- Fix clipped text of grid markers when they include 1000 displayed as 1K
0.2.0 :
- Initial implementation of bar_chart custom control
- New examples/graphs_and_charts/basic_bar_chart.rb
Quite wonderful. Thank you for the graphs and charts. This may
revolutionize the Ruby ecosystem, since Ruby is much in need of a good
and robust visualization library
which can stand on its own.
saji
···
On Tue, Jan 2, 2024 at 10:57 AM Andy Maleh via ruby-talk <ruby-talk@ml.ruby-lang.org> wrote:
Graphs and Charts 0.2.2 adds a new Bar Chart Custom Control for Glimmer DSL for LibUI (Prerequisite-Free Ruby Desktop Development Cross-Platform Native GUI Library).
https://raw.githubusercontent.com/AndyObtiva/glimmer-libui-cc-graphs_and_charts/master/screenshots/glimmer-libui-cc-graphs_and_charts-mac-basic-bar-chart.png
GitHub : GitHub - AndyObtiva/glimmer-libui-cc-graphs_and_charts: Graphs and Charts (Custom Controls) for Glimmer DSL for LibUI
RubyGem : glimmer-libui-cc-graphs_and_charts | RubyGems.org | your community gem host
Blog Post Announcement : Code Master Blog: Graphs and Charts 0.2.2 (Bar Chart for Glimmer DSL for LibUI)
Change Log:
0.2.2 :
- Display bar_chart axis labels x_axis_label and y_axis_label
- Display bar_chart x-axis values below the chart
- Fix issue with bar_chart vertical scaling of grid markers when numbers are larger than 1000 and have K in them by disabling K formatting for now (the issue was seeing the same marker number twice because two consecutive markers were calculated with similar shortened values; e.g. both 10K when one is 10100 and the other is 10750).
0.2.1 :
- Fix clipped text of grid markers when they include 1000 displayed as 1K
0.2.0 :
- Initial implementation of bar_chart custom control
- New examples/graphs_and_charts/basic_bar_chart.rb
______________________________________________
ruby-talk mailing list -- ruby-talk@ml.ruby-lang.org
To unsubscribe send an email to ruby-talk-leave@ml.ruby-lang.org
ruby-talk info -- Info | ruby-talk@ml.ruby-lang.org - ml.ruby-lang.org
--
______________________________________________
ruby-talk mailing list -- ruby-talk@ml.ruby-lang.org
To unsubscribe send an email to ruby-talk-leave@ml.ruby-lang.org
ruby-talk info -- Info | ruby-talk@ml.ruby-lang.org - ml.ruby-lang.org
